LiDAR (TF-Luna)
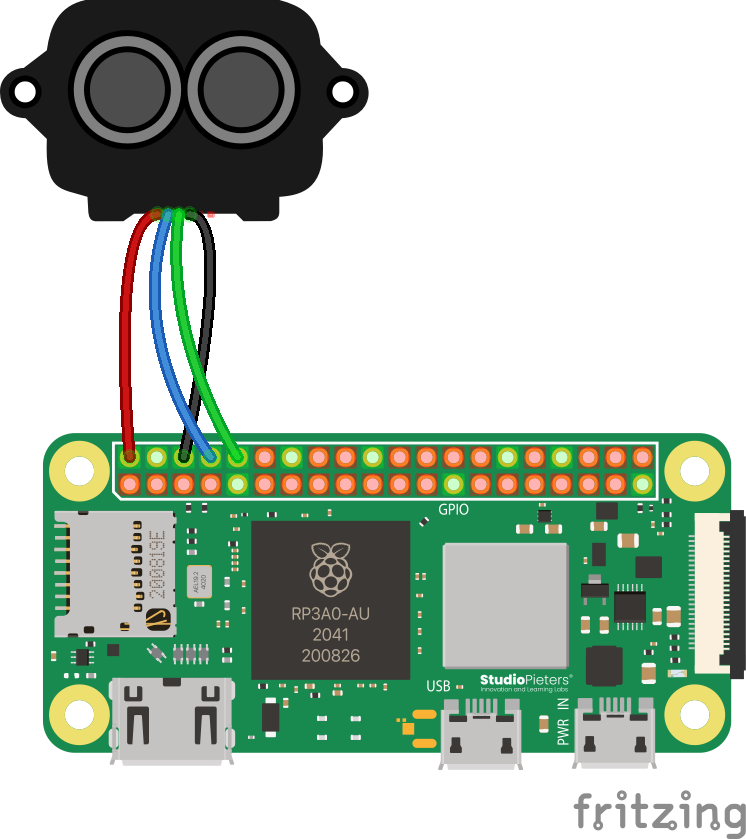
Wiring
Source files for these diagrams are available here.
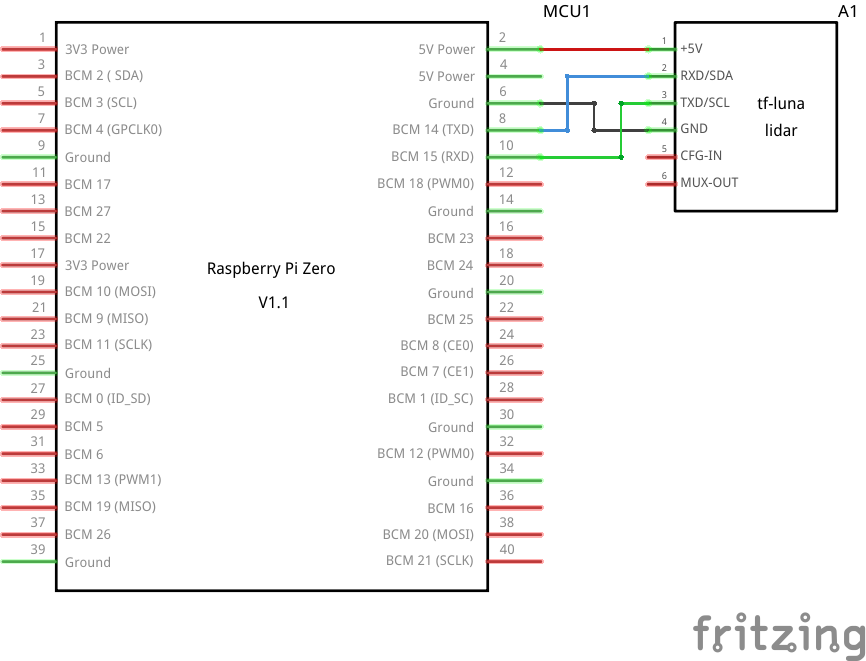
If the above diagram is unreadable or unclear, here is an alternate schematic:
Your TF-Luna can only be connected to with a special connector. The easiest way to connect it to your Pi is to cut off one side and solder your own ends. If you need help with soldering, contact a competition administrator on the Discord and we can help you with any issues you may be having.
Code
Again, like the previous sensors, the necessary library is included in the SDK, and as with the BMP180, Aerospace Jam rolls its own fork of the library for ease of use. You can get the source code here. From Python, you can quite easily use the library like this:
from tfluna import TFLuna

tfluna = TFLuna() # Create an object to represent the physical TF-Luna
tfluna.open() # We have to run this to open the sensor. It should be automatically closed when your code stops.
tfluna.set_samp_rate(5) # 5Hz, so 5 samples per second. The higher this number is, the less accurate the measurements are but the faster they come through.

distance, strength, temperature = tfluna.read() # This uses special syntax called a "tuple" to set all three variables at once from the same function.
# Now, we can simply access them:
print(f"Distance: {round(distance * 100.0, 2)} cm")
print(f"Strength: {strength}")
print(f"Temperature: {temperature} C")
Troubleshooting
- Keep in mind that Tx and Rx connections should be reversed - they stand for "transmission" and "reception", respectively - so they need to be alternated. The transmission of one device should be connected to the reception of another device, and vice versa. If you connect Tx to Tx and Rx to Rx, then nothing will work.
Advanced: 2D Mapping with a Gyroscope
By spinning your vehicle in place while taking distance measurements, you can create a 2D map of the surrounding environment. This requires combining the distance data from the LiDAR with rotational data from a gyroscope. Here are some hints on how to approach this challenge.
Understanding Polar Coordinates
The data you collect from the sensors — a distance and an angle — naturally forms a polar coordinate. A polar coordinate (r, θ) defines a point's position in a plane by its distance r (radius) from a central point and an angle θ (theta) from a reference direction.
r(radius): This is the distance value you get directly from the TF-Luna sensor.θ(theta): This is the total angle your vehicle has rotated, which you must calculate from the gyroscope data's dead reckoning.
Your goal is to collect a series of these (r, θ) points as you rotate a full 360 degrees.
From Sensor Data to a Map Plot
While you collect data in polar coordinates, most charting libraries (like Chart.js or D3.js) expect Cartesian coordinates (x, y) to create a scatter plot. The key part of this challenge is the conversion.
-
Track the Angle: A gyroscope gives you the rate of rotation (e.g., in degrees per second), not a fixed angle. To find your current angle, you must continuously add up the small changes in rotation over time. In a loop, measure the time that has passed (
delta_time), multiply it by the current rotation rate, and add the result to your totalcurrent_angle. This process is called integration. -
Collect the Data: As your vehicle spins, your Python code should loop quickly, doing two things at nearly the same time: get the current distance from the LiDAR and calculate the current angle from the gyroscope. Store each (
angle,distance) pair together in a list. Wait until the full 360-degree rotation is complete, then send this entire list of data to your web client in a single Socket.IO event. -
Convert to Cartesian Coordinates: Once your JavaScript client receives the list of polar coordinates, it must convert each one to an (
x,y) point before plotting. Use the following standard conversion formulas for each (r,θ) pair:x = r * cos(θ)y = r * sin(θ)A scatter plot of these
xandypoints will reveal a top-down map of the surfaces detected by the LiDAR.Watch Your Units!The trigonometric functions in JavaScript (
Math.cos()andMath.sin()) require the angleθto be in radians, not degrees. Before you perform the conversion, you must convert your angle from degrees to radians:radians = degrees * (Math.PI / 180)
Advanced: Reading Data Manually
This section is for teams who are not using the SDK or who want to write their own sensor library in a different language. The following steps outline the communication protocol and data parsing required to get readings directly from the TF-Luna. The primary method of communication with the Raspberry Pi is via its UART serial interface.
These instructions are based on the official Benewake TF-Luna product manual. The process requires careful implementation of serial communication. For the ultimate source of truth, please refer to the TF-Luna Instruction Manual.
The process can be broken down into two main steps:
- Establish UART communication with the sensor.
- Read and parse the 9-byte data packet for distance, signal strength, and temperature.
Step 1: Establish UART Communication
The TF-Luna communicates over a UART serial interface. You must configure the serial port on your Raspberry Pi to match the sensor's settings.
- Baud Rate: 115200 bps (default)
- Data Bits: 8
- Parity: None
- Stop Bits: 1
Ensure that the Raspberry Pi's hardware serial port is enabled and configured correctly. This often involves using raspi-config to enable the serial interface and disabling the serial console.
Step 2: Read and Parse the Data Packet
The TF-Luna continuously sends a 9-byte data packet at the configured frame rate (default is 100Hz). Your task is to read this packet from the serial buffer and extract the relevant information.
The standard data packet is structured as follows:
| Byte Index | Field | Description |
|---|---|---|
| 0 | Frame Header | Fixed value: 0x59 |
| 1 | Frame Header | Fixed value: 0x59 |
| 2 | Dist_L | Low byte of the distance value |
| 3 | Dist_H | High byte of the distance value |
| 4 | Strength_L | Low byte of the signal strength |
| 5 | Strength_H | High byte of the signal strength |
| 6 | Temp_L | Low byte of the chip temperature |
| 7 | Temp_H | High byte of the chip temperature |
| 8 | Checksum | Sum of bytes 0 through 7 |
A. Reading the Packet
- Continuously read the serial port until you receive the two frame header bytes (
0x59,0x59). This ensures you start reading from the beginning of a data packet. - Once the header is found, read the next 7 bytes to complete the packet.
B. Calculating the Values
The multi-byte values are transmitted in little-endian format.
-
Distance (cm):
Distance = (Dist_H << 8) | Dist_LThe resulting value is the distance in centimeters. The effective range is 20cm to 8m. Readings below 20cm are unreliable. -
Signal Strength:
Strength = (Strength_H << 8) | Strength_LThis value indicates the strength of the return signal. A lower value (e.g., below 100) or a very high value (e.g., 65535) can indicate an unreliable reading. -
Chip Temperature (°C):
Temperature = ((Temp_H << 8) | Temp_L) / 8 - 256The result is the internal chip temperature in degrees Celsius.
C. Verifying the Checksum
To ensure data integrity, you can verify the checksum:
- Calculate the sum of the first 8 bytes of the received packet (from index 0 to 7).
- Compare the lower 8 bits of your calculated sum with the received checksum byte (at index 8). If they match, the packet is likely valid.
Sending Commands (Optional)
You can also send commands to the TF-Luna to configure settings like the sample rate or to trigger a single measurement. Commands are sent as a multi-byte sequence. For example, to set the sample rate, you would send:
0x5A, 0x06, 0x03, [rate_L], [rate_H], [checksum]
Where rate_L and rate_H are the low and high bytes of the desired frequency. For more details on available commands, refer to the official product manual.